
Google Analytics is a tool used primarily by marketers, SEO consultants, content developers, etc. which tracks and reports website traffic. It offers a variety of useful information, covering everything from bounce rates to lead generation. While the information provided is plentiful and useful, I’ve found it tends to be an under-utilized tool for front-end developers. This is due in part to its reputation as a content/marketing tool and perhaps in larger part due to the convoluted nature of the reports and system navigation. If you’re a front-end developer interested in learning more about how Google Analytics can help with building new sites and monitoring existing ones, read on for information about analyzing the data and building a dashboard.
Google Analytics for a Website Upgrade
When you’re redesigning and rebuilding an existing website, you can glean a lot of useful information from Google Analytics which should help to inform the development process. You won’t need to build any dashboard widgets for this information as it’ll be used one time only, but it’s very helpful information to have on hand.
Screen Resolution Breakdown
The screen resolution breakdown shows you the various screen sizes that are used to access your website. With this information, you can get a better sense of how the site is most often viewed, whether it’s with huge desktop monitors or tiny 11” laptop screens.
To access the screen resolution breakdown:
- Click on ‘Behavior’ in the left nav menu
- Click on ‘All Pages’
- Change the primary dimension to ‘Other > Screen Resolution’
- Review the results – this is the number of page visits per resolution size

Page views by screen resolution
Browser Usage Breakdown
When you’re rebuilding a website, one very important decision you’ll have to make is which browsers and versions to support. While client input will be a big factor in this decision, analyzing the browser usage statistics for the current site can help to make the most educated choices. Not only can you view overall traffic from Chrome, Firefox, Internet Explorer and more, you can also break browsers down by version – that way you can make a solid argument against why you really, really, really don’t need to support IE6.
To access the browser usage breakdown:
- Click on ‘Behavior’ in the left nav menu
- Click on ‘All Pages’
- Change the primary dimension to ‘Other > Browser’
- Review the results – this is the number of page visits per browser (overall, not broken down by version)
If you want to view the browser usage breakdown taking into account different browser versions, you’ll need to set the secondary dimension to ‘Browser Version’ using the dropdown menu.

Page views by browser version
Device Usage Breakdown
Knowing the browser is helpful for starting to figure out which devices are most commonly used to access your site, but the iOS operating system could mean an iPad, an iPhone, an iPod touch and any of the device versions. A better option is to take advantage of the mobile device information. Here you can see pageviews, bounce rates, etc. broken down by device type.
To access the device usage breakdown:
- Click on ‘Audience’ in the left nav menu
- Click on ‘Mobile’
- Click on ‘Devices’
- Review the results – this is the number of page visits per device

Page views by mobile device
Monitoring Technical Site Performance (Building a Dashboard)
Content creators, marketers and other similar professions use Google Analytics to measure the performance of website content. As developers, it’s our responsibility to monitor the technical performace of the website and stay on top of how the website is being view and used. You can find all of the information below by clicking through the navigation, but if you make the time investment to build a dashboard one time you can gather important information at a glance with one login a day.
Creating a Google Analytics Dashboard
A Google Analytics dashboard is a helpful tool for providing custom reports at a glance. The dashboard is comprised of various widgets which showcase the information of your choosing. It’s easy to get started, but you can spend a long time tweaking and perfecting the available data.
- Click on ‘Dashboards’ in the left nav menu
- Click on ‘New Dashboard’
- Start with a blank canvas
- Name the dashboard and create it

Creating a new dashboard
Browser and Device Usage Widgets
It’s important to keep up to date with the devices and browsers being used to access your site – this helps you to stay on top of bugs and ensure that users are having the best experience possible. It’s easy to add widgets to the dashboard, to keep track of views by browser, device and screen size.
Page Views by Browser
To track the most-used browsers on your site, you’ll need to add a page view widget.
- Click on ‘Add Widget’
- Give your widget a title
- Select ‘Standard > Table’ for the widget display
- Add ‘Browser’ as the primary dimension
- Add ‘Pageviews’ as the metric
- Select the number of rows
- Save

A widget to see page views by browser
Page Views by Device
Reporting the device views is a very similar process to the browser views:
- Click on ‘Add Widget’
- Give your widget a title
- Select ‘Standard > Table’ for the widget display
- Add ‘Mobile Device Info’ as the primary dimension
- Add ‘Pageviews’ as the metric
- Select the number of rows
- Save

A widget to see page views by device
Page Views by Resolution
Last but not least, let’s make sure you stay on top of the screen sizes being utilized to view your site:
- Click on ‘Add Widget’
- Give your widget a title
- Select ‘Standard > Table’ for the widget display
- Add ‘Screen Resolution’ as the primary dimension
- Add ‘Pageviews’ as the metric
- Select the number of rows
- Save
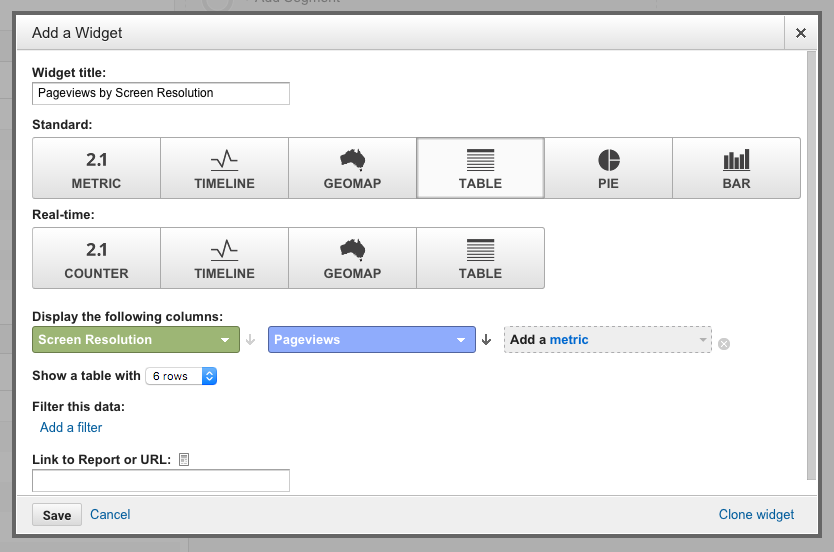
A widget to see page views by resolution
Page Load Time Widgets
Average Page Load Time
Once your load time goes over ~2 seconds, you start to see a drop-off in traffic. Monitoring your website load times is an important maintenace task, and Google Analytics makes it easy to get an overview of the information. This widget provides a simple number which is the average load time across all website pages and devices
- Click on ‘Add Widget’
- Give your widget a title
- Select ‘Standard > Metric’ for the widget display
- Add ‘Avg. Page Load Time’ as the metric
- Save

A widget to see the average page load time
Browser Page Load Time
The number above is helpful, but if performance is declining it’s helpful to see which browsers are effected. This widget breaks down average load time by major browsers.
- Click on ‘Add Widget’
- Give your widget a title
- Select ‘Standard > Table’ for the widget display
- Add ‘Browser’ as the primary dimension
- Add ‘Avg. Page Load Time’ as the metric
- Select the number of rows
- Save

A widget to see the average page load time by browser
Device Page Load Time
Another useful breakdown is by the various mobile devices.
- Click on ‘Add Widget’
- Give your widget a title
- Select ‘Standard > Table’ for the widget display
- Add ‘Mobile Device Info’ as the primary dimension
- Add ‘Avg. Page Load Time’ as the metric
- Select the number of rows
- Save
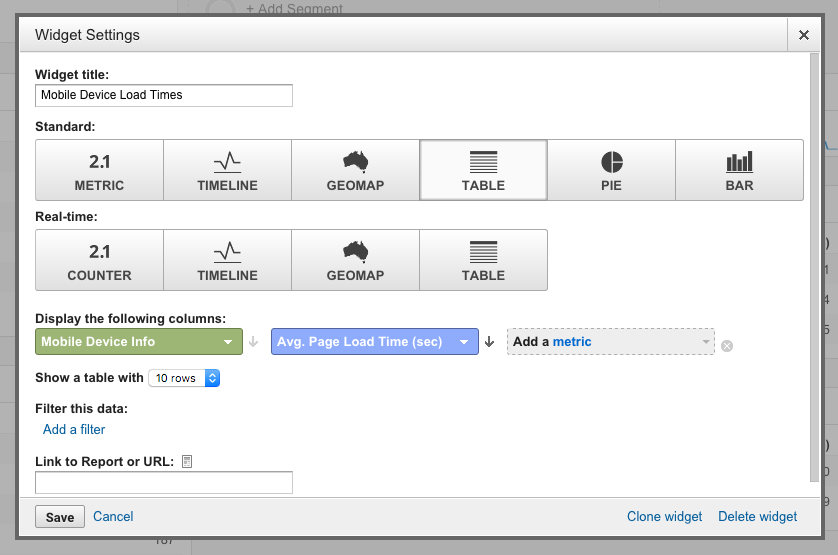
A widget to see the average page load time by device
OS Page Load Time
Last but not least, sometimes the various operating systems can cause page load issues. This widget breaks down the average page load time by major operating systems.
- Click on ‘Add Widget’
- Give your widget a title
- Select ‘Standard > Table’ for the widget display
- Add ‘Operating System’ as the primary dimension
- Add ‘Avg. Page Load Time’ as the metric
- Select the number of rows
- Save

A widget to see the average page load time by operating system
Server and Domain Monitoring Widgets
If load times are down, the problem is often with a specific device or browser which the previous widgets cover. Occasionally, the problem lies with the server. These widgets help monitor useful statistics to help troubleshoot page load issues.
Average Domain Lookup Time
The first step to loading your site is to look up the domain. Use this widget to keep track of how long the domain takes to be reached.
- Click on ‘Add Widget’
- Give your widget a title
- Select ‘Standard > Metric’ for the widget display
- Add ‘Avg. Domain Lookup Time’ as the metric
- Save

A widget to see the domain response time
Average Server Connection Time
With this widget, keep track of how long it takes to reach your server. If this number is really high, consider using a CDN to cache content around the globe.
- Click on ‘Add Widget’
- Give your widget a title
- Select ‘Standard > Metric’ for the widget display
- Add ‘Avg. Server Connection Time’ as the metric
- Save

A widget to see the server connect time
Average Server Response Time
This widget helps you to monitor the time it takes to start loading data from your server – the smaller this number the faster the user will get a response.
- Click on ‘Add Widget’
- Give your widget a title
- Select ‘Standard > Metric’ for the widget display
- Add ‘Avg. Server Response Time’ as the metric
- Save

This dashboard is going to be a great way to monitor your site performance. Use this tutorial as a foundation, and add/tweak the widgets as needed. Questions or comments? Share them below!
Get a Faster Start
Get up and running by importing my pre-made dashboard.